
Merck’s Kaushal Kishore attempts to illustrate why pharma companies have struggled to crack what he calls “the Gross to Net (GtN) code.” He outlines the maturity journey for a pharma commercial and pricing organisation which can lead to maturity on the GtN topic, and highlights a successful example that can lead to GtN optimisation not only for pharma and life science companies but also those other sectors, leading to overall revenue and price optimisation. Kishore looks to provide cues on the journey and techniques to navigate through the GtN challenge, noting that GtN can be optimised via different techniques and be used in both ‘reimbursed’ and ‘out of pocket’ markets. This article focuses on the latter.*
Gross to Net – The ‘Achilles Heel’ of Pharma Pricing
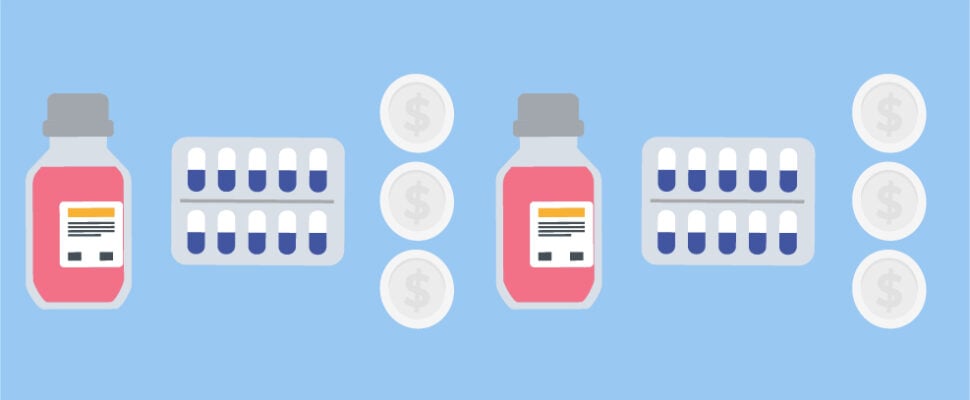
As the pharma industry attempts to navigate a plethora of challenges, including patent expiry, supply chain issues, increased competition, and ever-increasing price pressure from payers, ‘Gross to Net’ is becoming a key topic in pharma pricing. Gross to net (GtN) is the difference between the gross price and net price of any product. This accounts for all discounts to third parties including ‘on-invoice’ and ‘off-invoice’ discounts. It is challenging to have transparency in GtN adjustments as they have been increasing rapidly, especially for mature portfolios that are in their late life cycle and have lost patent protection. For example, in the US, GtN difference increased by 12 percent year-on-year in 2022. This means that despite rising list prices, pharma companies are not able to reap the benefits while R&D costs are rising steeply. Understanding and optimising GtN is key to optimising price and profitability which can have a direct positive impact on the bottom line. Easier said than done, this topic has been as elusive as a chimaera for quite some time.
The Maturity Journey towards GtN and Opportunities
Pharma and life science companies are at various stages of the maturity journey depicted in the diagram below. The maturity stage will most likely decide the maturity of GtN and hence the ability to maximise or optimise prices through GtN.
Interestingly, pricing maturity is independent of the size and sales figures of pharma companies. Based on the study of around seven pharma companies big and small, their maturity index varied. The below diagram shows four levels of pricing maturity in a company.
Made with Visme Infographic Maker
The framework used for GtN pricing optimisation and the four key steps are shown in the industry example below.
Made with Visme Infographic Maker
1. Develop a GtN framework
Mapped customers’ turnover with the discounts/rebates to generate a GtN corridor with an acceptable range of discounts.
Made with Visme Infographic Maker
2. Incentivise volume growth
Wherever applicable, GtN was adjusted using the “Give-and-take” principle, e.g., the company shifted more GtN volume to high performers and introduced growth-oriented rebates for small-sized players.
3. Analyse the outliers
Reasons for major deviations were studied e.g. – additional discounts for customers located in a remote area, data inconsistencies, etc. and a customised solution was devised.
4. Execute a tailored approach
For one customer, four years of data on two brands A & B were analysed:
- For Brand A, the consumer price was increasing while its purchase cost remained constant. In coordination with the Commercial team, the possibility of adjusting discounts and increasing prices was investigated and implemented (to distributor and thus pharmacies).
- For Brand B, the consumer price was increased by six percent and PPP decreased by eight percent, due to which the company made less money per unit sold. Therefore, discounts were revisited which led to renegotiation and an increase in pharmacy purchasing prices.
This exercise was done for multiple other accounts with similar patterns and KPIs.
Made with Visme Infographic Maker
As an outcome of this GtN optimisation project, the company achieved +8.3m EUR in top-line improvement and +2.3m EUR in GtN reduction:
Made with Visme Infographic Maker
Conclusion: A Dollar Saved is a Dollar Earned
This example illustrates that GtN optimisation can be an impactful exercise for all Pharma companies, especially for mature product portfolios. A small percentage improvement in the margin can lead to a million-dollar impact on a brand and portfolio. As the famous saying goes ‘A dollar saved is a dollar earned.’
In the current economic context, this would be the ideal time to get the basics right and focus on this topic. Although this article illustrates an example and approach, there is no one-size-fits-all solution. This exercise must be done after an assessment of organisational maturity and overall processes and might need some tweaks in the approach. Some organisations are already mid-way through the pricing maturity journey and investing heavily in off-the-shelf pricing solutions which consume their resources and time. Unfortunately, some of these ‘Big Budget’ pricing solution implementations are not reaping the desired business benefits. Therefore, this would be the time to switch gears and demonstrate business value through such an exercise.
It goes without saying that a leap of faith and mandate is also needed, quite apart from active collaboration. Pricing is gradually becoming the cornerstone of success in pharma and life science companies. Sooner or later, as organisations reach level three or four in their maturity journeys, the collection and optimisation of GtN data will become seamless.
* The numbers and examples given in this article are illustrative and do not contain any confidential information