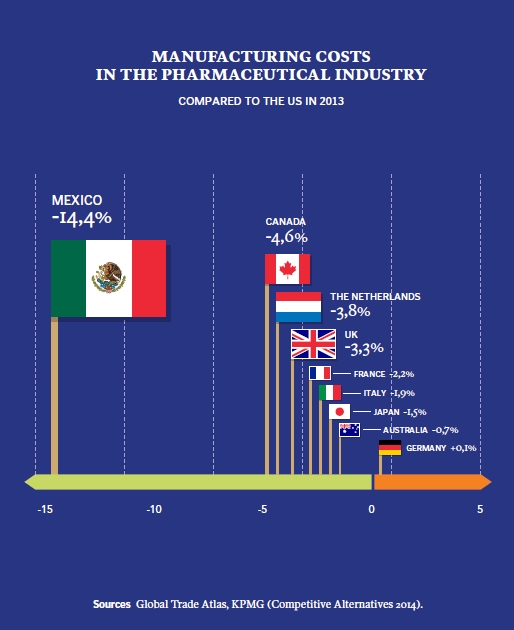
This chart shows the manufacturing costs in the Mexican pharmaceutical industry (compared to the US in 2013).
For more data on the Mexican market, please download our latest 2015 free report here.


See our Cookie Privacy Policy Here