Italy An overview of Italy’s pharma, biotech and medtech sectors by number of companies, production value, R&D investment, and number of employees. Made with Visme Infographic Maker The Italian companies involved in healthcare, split by specialisation, R&D spend, and turnover Made with Visme Infographic Maker Italy’s regions and their…
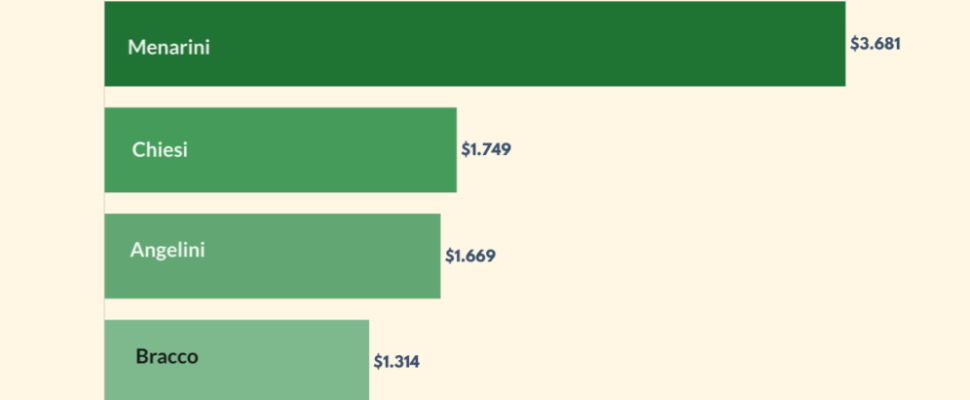
Italy Italy’s pharma industry consistently ranks among the top 10 globally, with domestic companies making up a significant share. These, largely private family-owned firms also have an increasingly global footprint, with international operations now making up a larger portion of their revenues than ever before. See below for the top six…
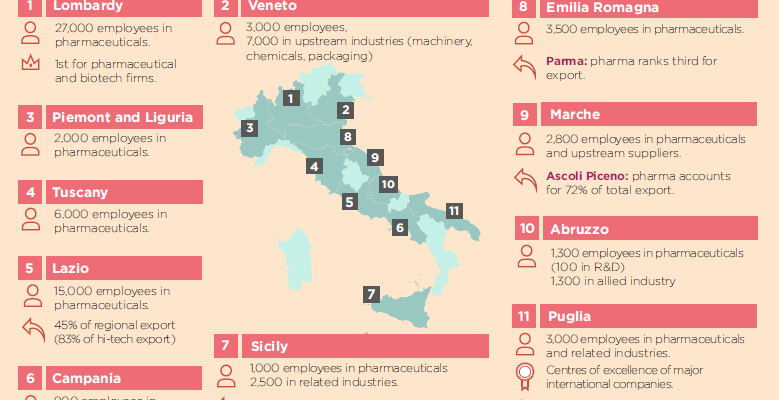
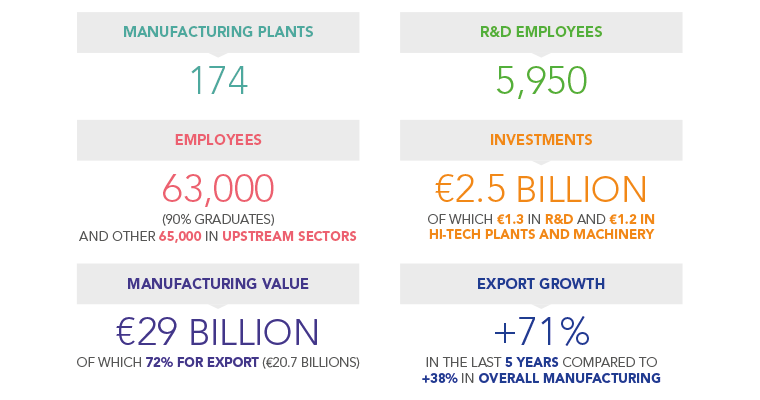
Key Stats The following chart gives the key statistics on the Italian pharmaceutical industry; from number of manufacturing plants, to investments and export growth. Italy Pharma Map The following map shows the importance of the pharmaceutical industry to the highly regionalised Italian industry. Lombardy in the North of Italy employs 27,000…
Pharma The following map shows the importance of the pharmaceutical industry to the highly regionalised Italian industry. Lombardy in the North of Italy employs 27,000 people in pharmaceuticals and is ranked number one for pharma and biotech firms. Click here to read more articles and interviews from Italy, and to download…
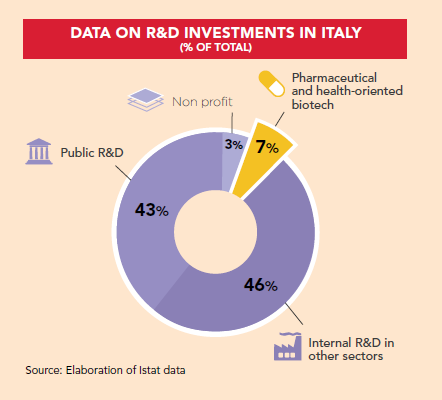
Pharma The below chart shows the sources of funding for R&D investment in Italy, with only 7% of total investment originating from pharmaceutical and health-oriented biotech. Click here to read more articles and interviews from Italy, and to download the latest free pharma report on the country.
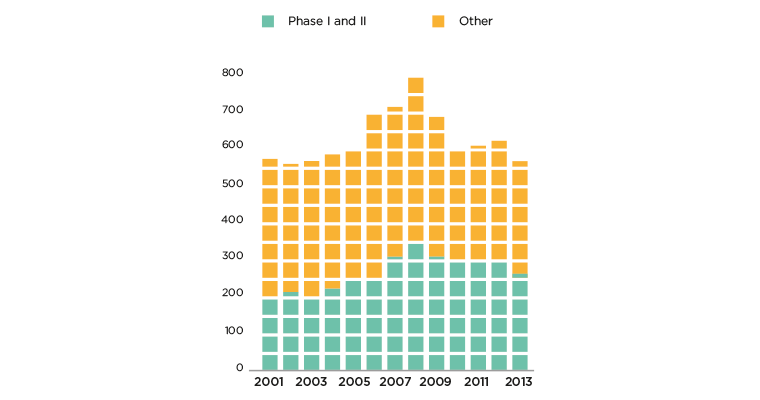
Pharma The following chart shows the number of clinical trials in Italy per year. Peaking in 2008 and slumping slightly shortly after, the numbers have returned to robust levels with 550+ trials in total in 2013 and 250+ important Phase I and II trials. Click here to read more articles and…
Pharma The following chart gives the key statistics on the Italian pharmaceutical industry; from number of manufacturing plants, to investments and export growth. Click here to read more articles and interviews from Italy, and to download the latest free pharma report on the country.
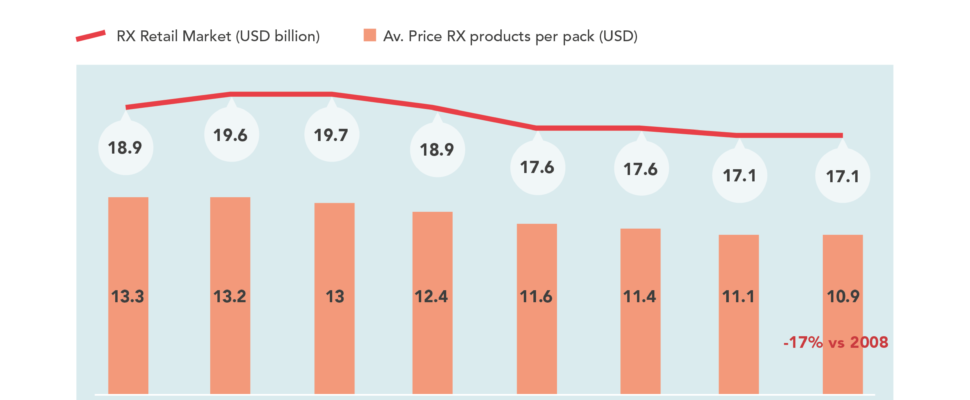
Pharma The following chart shows the decline of the RX retail market in Italy since 2008, along with the 17% decrease in the average price of RX products per pack in 2015 from 2008. Because of the rise of generics, new chemical entities are often restricted to non-retail channels. Click here…
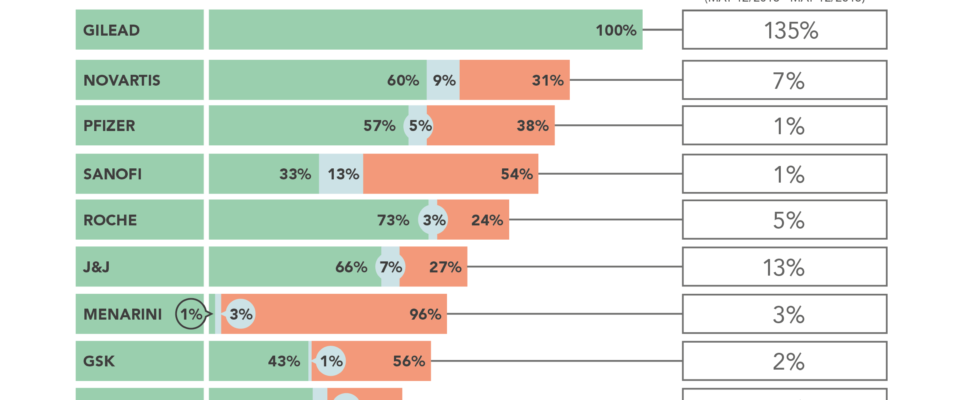
Pharma The following chart shows the leading innovators in Italian pharmaceuticals. Gilead leads the way with 135% growth, all of which comes from the hospitals sector. Click here to read more articles and interviews from Italy, and to download the latest free pharma report on the country.
See our Cookie Privacy Policy Here